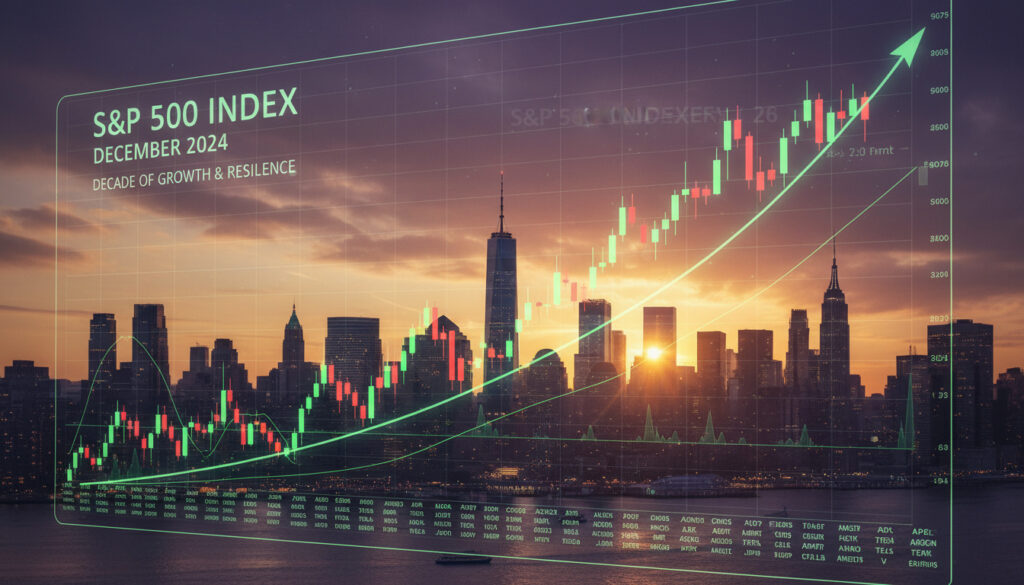
.INX – S&P 500 Index History Components Performance
The .INX ticker represents the S&P 500 Index, a market-capitalization-weighted benchmark tracking 500 leading U.S. publicly traded companies. Functionally equivalent to ^GSPC and SPX, this index covers approximately 80% of available U.S. market capitalization, serving as the primary gauge for American equity performance since its computer-assisted inception in 1957.
Investors encounter the .INX designation across financial platforms where it denotes the same underlying basket of securities governed by S&P Dow Jones Indices. Unlike exchange-traded funds, .INX itself is not a directly tradable asset, though its movements dictate the value of trillions of dollars in passive investment products and derivatives worldwide.
What Is the .INX Index and How Does It Work?
Benchmark Definition
Real-time price index tracking 500 large-cap U.S. equities across diverse economic sectors.
Market Scope
Covers approximately 80% of available U.S. market capitalization through weighted representation.
Weighting Method
Float-adjusted market-capitalization weighting concentrates influence among the largest enterprises.
Primary Function
Foundation for index funds, derivatives, and broad economic health indicators.
- Market-cap weighting amplifies the influence of technology and healthcare giants versus smaller constituents
- Historical performance shows approximately 10% average nominal annual returns since 1957, despite significant volatility periods
- Corporate longevity varies dramatically; only 53 of the original 1957 constituent companies remain in the index today
- Strict eligibility requires meeting liquidity, financial viability, and sector balance criteria maintained by S&P Dow Jones Indices
- Ticker variations include .INX, ^GSPC, and SPX depending on the data provider or trading platform
- Turnover peaked in 1976 with 60 component changes, including 40 financial stocks previously excluded from OTC trading
- Construction methodology originated as the first computer-generated index using electronic punch card systems
| Attribute | Details |
|---|---|
| Index Name | S&P 500 |
| Primary Tickers | .INX, ^GSPC, SPX |
| Inception Date | March 4, 1957 |
| Number of Constituents | 500 large-cap U.S. companies |
| Weighting Methodology | Market-capitalization weighted |
| Market Coverage | ~80% of U.S. equity market cap |
| Historical Average Return | ~10% annualized (nominal, not inflation-adjusted) |
| Index Manager | S&P Dow Jones Indices (S&P Global) |
| Original Constituents Remaining | 53 companies |
| Record Turnover Year | 1976 (60 changes) |
How Has the S&P 500 Composition Changed Over Time?
From Industrial Giants to Technology Leaders
Launched on March 4, 1957, the original S&P 500 comprised industrial heavyweights including General Electric, U.S. Steel, and DuPont. The methodology marked a technological milestone as the first computer-generated stock index, utilizing electronic punch cards to monitor constituent performance. By the 1980s and 1990s, the composition shifted dramatically with the addition of Microsoft, Intel, and Cisco Systems, reflecting the emerging dominance of information technology.
The 1976 Financial Sector Inclusion
The index experienced its highest turnover rate in 1976, when 60 companies joined or left the benchmark. This reconstitution included 40 financial stocks such as Wells Fargo, previously excluded due to over-the-counter trading restrictions. Historical records indicate earlier additions including Whirlpool and Texas Instruments in 1959, Kellogg in 1961, and Textron in 1963, demonstrating the gradual evolution from pure industrial representation toward sector diversification.
Of the 500 companies present at the 1957 launch, only 53 remain in the index today due to mergers, bankruptcies, and delistings. This attrition rate underscores the dynamic nature of American corporate leadership across seven decades.
What Are the Practical Ways to Track and Trade .INX?
Understanding Ticker Symbols Across Platforms
Financial data providers display the same underlying S&P 500 price data through different ticker symbologies. While .INX appears on certain charting platforms, equivalent designations include ^GSPC and $SPX. The CBOE utilizes SPX for options contracts referencing the index. Investors seeking real-time valuations should verify which symbol their specific brokerage or analysis platform employs, as data feeds may vary in latency and precision.
Investment Vehicles and ETF Replication
Direct ownership of .INX remains impossible, as it is a calculated benchmark rather than a tradable security. Exposure requires purchasing exchange-traded funds that replicate constituent weights, primarily the SPDR S&P 500 ETF Trust (SPY) or the Vanguard S&P 500 ETF (VOO). These funds adjust holdings automatically to match index changes, allowing retail investors to mirror the aggregate performance of the 500 member companies without managing individual stock positions. Institutional participants may utilize SPX options for hedging or speculative strategies.
While .INX serves as a price index reference, investors cannot buy the index directly. Exposure requires purchasing ETFs such as the SPDR S&P 500 ETF Trust (SPY) or the Vanguard S&P 500 ETF (VOO), which replicate the underlying constituent weights.
What Factors Drive S&P 500 Performance?
Market Capitalization Concentration
The capitalization-weighted structure inherently concentrates index movement within the largest member companies. Current components sortable by market value reveal that technology giants exert disproportionate influence over daily price fluctuations. This mathematical property means that earnings announcements or regulatory developments affecting trillion-dollar firms generate greater index volatility than equivalent events affecting smaller constituents, creating a feedback loop where mega-cap performance increasingly defines overall benchmark returns.
Historical Volatility Periods
Long-term averages mask significant intervening volatility. The index declined throughout the 1969-1981 period amid high inflation and economic stagnation. The 2008 financial crisis generated dramatic losses requiring years for recovery. More recently, the COVID-19 pandemic introduced acute volatility followed by technology-led rebounds. Survivorship-bias-free analysis requires examining historical constituent data rather than current membership alone, as failed or merged companies disappear from standard datasets.
Historical performance averages approximately 10% annually, but this figure masks significant variability. The index experienced negative returns during the 1969-1981 stagnation period and the 2008 financial crisis, demonstrating that long-term averages do not guarantee short-term results.
How Did the S&P 500 Develop From 1923 to Present?
- 1923: Standard & Poor’s creates a weekly index tracking 233 U.S. companies, establishing the precursor to the modern benchmark — source: Madison Trust
- March 4, 1957: Formal S&P 500 launched as the first computer-generated index using electronic punch card technology to monitor 500 large publicly traded companies — source: Madison Trust
- 1959: Whirlpool (WHR) and Texas Instruments (TXN) added to the constituent list — source: WRDS Wharton
- 1961: Kellogg (K) joins the index as the food sector gains representation — source: WRDS Wharton
- 1963: Textron (TXT) enters the benchmark, reflecting evolving industrial diversification — source: WRDS Wharton
- 1976: Record turnover occurs with 60 component changes, including 40 financial stocks previously excluded from OTC trading — source: WRDS Wharton
- 2008: Financial crisis generates severe index declines as banking and housing sectors collapse — source: Madison Trust
- 2020: COVID-19 pandemic triggers market volatility followed by technology and healthcare sector recovery — source: Madison Trust
What Is Definitively Established About .INX Symbol Usage?
| Established Facts | Points Requiring Clarification |
|---|---|
| .INX denotes the S&P 500 price index on specific financial data platforms and charting services | Real-time values fluctuate continuously; verified data feeds required for precise trading decisions |
| Mathematically equivalent to ^GSPC (Yahoo Finance) and SPX (CBOE options contracts) | Exact ticker syntax and availability vary by brokerage platform and geographic jurisdiction |
| Represents 500 U.S. large-cap stocks selected by S&P Dow Jones Indices methodology | Daily component lists subject to corporate actions, mergers, and eligibility changes |
| Historical constituent data available from January 2000 showing over 240 changes | Survivorship-bias-free analysis requires accessing delisted company records separately |
Why Does the S&P 500 Remain the Definitive U.S. Market Barometer?
The S&P 500 distinguishes itself from price-weighted alternatives like the Dow Jones Industrial Average through its capitalization-based methodology, which better reflects the economic impact of corporate scale. Car Wash Near Me – Guide to Types, Costs and Best Times illustrates how diverse market sectors require distinct analytical frameworks, much as the S&P 500’s broad coverage differs from technology-heavy indices like the Nasdaq Composite. Covering roughly 80 percent of available U.S. market capitalization, the benchmark provides institutional investors with a proxy for overall equity market health while serving as the reference point for trillions in passive investment assets.
Sector composition has shifted markedly from the industrial dominance of the 1950s to current configurations emphasizing healthcare, technology, and financial services. This evolution mirrors structural changes in the American economy, from manufacturing-based growth to service and information-based productivity. The index’s managed turnover ensures representation remains aligned with contemporary economic reality, even as specific corporate constituents enter and exit based on mergers, bankruptcies, or market cap declines.
What Do Primary Authorities State About the Index?
The S&P 500 is widely regarded as the best single gauge of large-cap U.S. equities.
— S&P Dow Jones Indices
The index serves as a market benchmark for many index funds and ETFs, providing investors with broad exposure to the U.S. stock market.
Core Insights on the .INX Index
The .INX ticker provides investors with a window into the S&P 500, a capitalization-weighted benchmark representing 500 leading American companies since 1957. While historical performance averages approximately 10 percent annually, the index exhibits significant volatility, with only 53 original constituents remaining today. Investors gain exposure through ETFs like SPY or VOO rather than direct index purchases, tracking equivalent symbols including ^GSPC and SPX across different platforms. Suite Life of Zack and Cody – Cast, Episodes, Cancellation Guide demonstrates how comprehensive research methods apply across diverse subjects, from financial benchmarks to entertainment industry analysis.
Frequently Asked Questions
What distinguishes .INX from the SPX ticker symbol?
.INX and SPX represent the same underlying S&P 500 price data. .INX appears on certain charting platforms like BigCharts, while SPX denotes the index on the Chicago Board Options Exchange for derivatives trading.
How frequently are companies removed from the S&P 500?
Changes occur as needed based on eligibility criteria. Data since 2000 shows over 240 constituent changes. The highest turnover occurred in 1976 with 60 additions and removals.
Does the .INX price include dividend reinvestment?
No, .INX tracks the price return version of the S&P 500. Total return indices accounting for dividend reinvestment carry different designations and typically show higher cumulative performance.
What criteria determine S&P 500 eligibility?
S&P Dow Jones Indices evaluates market capitalization, liquidity, financial viability, and sector balance. Companies must be U.S. headquartered with adequate trading history and public float.
Which technology companies entered the index during the 1990s?
Microsoft, Intel, and Cisco Systems joined during the 1980s and 1990s, marking the shift from industrial dominance toward information technology representation.
How did the 1976 financial sector inclusion change the index?
Prior to 1976, many banks traded over-the-counter rather than on major exchanges. The 1976 reconstitution added 40 financial stocks including Wells Fargo, diversifying sector representation.
Where can investors verify real-time .INX valuations?
Platforms like TradingView provide current component lists and pricing. Yahoo Finance displays the equivalent ^GSPC ticker. Official methodology documents reside at S&P Dow Jones Indices.
More related posts
 Brigette Lundy-Paine (Jack Haven): Gender, Name Change, Biography
 French Toast Casserole Recipe: How to Fix Common Mistakes
 Chargers vs Eagles Match Player Stats: Game Recap 2025
 Who Moved My Cheese – Summary, Lessons and Key Insights
 National Ice Cream Day 2026: Date, History, Deals & Myths
 Rebecca Ferguson Movies and TV Shows – Complete Guide
 How Many Yards in a Mile? 1,760 Yards and Key Conversions
 Fire Force Online Codes (June 2026): Active & How to Redeem